Monitoring In-memory datastores
This blog post covers monitoring in-memory datastores, focusing on Dragonfly. Learn how to use Prometheus and Grafana to monitor Dragonfly metrics and visualize them on a dashboard. Explore memory consumption, client-side metrics, server metrics and more.
June 21, 2023

Introduction
Monitoring in-memory datastores requires a different approach to traditional disk-based databases. Since in-memory datastores are designed to store data in RAM, there's a greater risk of the datastore exceeding the allocated memory limit. When this happens, the datastore may have to evict data (e.g. Redis evicts keys based on the configured policy such as LRU) or it may become unstable or crash, leading to data loss or downtime.
Therefore, tracking memory consumption is one of the key focus areas when monitoring in-memory datastores. However, there are other important metrics to be considered as well, including client-side metrics that provide insight into how client applications are using the datastore as well as other server-side metrics (for example, ones related to CPU usage).
In this blog post, we will explore how to monitor Dragonfly using Prometheus and add Grafana for visualization.
Dragonfly is a modern in-memory datastore that implements novel algorithms and data structures on top of a multi-threaded, shared-nothing architecture. Thanks to its API compatibility, Dragonfly can act as a drop-in replacement for Redis. At the time of writing, Dragonfly has implemented more than 200 Redis commands which represents good coverage for the vast majority of use cases. Due to Dragonfly\'s hardware efficiency, you can run a single node instance on a small 8GB instance or scale vertically to large 768GB machines with 64 cores. This greatly reduces infrastructure costs as well as architectural complexity.
Getting Started: Monitoring Dragonfly With Prometheus
A Prometheus Exporter can be used in scenarios where it is not feasible to instrument a given system with Prometheus metrics directly. It collects metrics from a specific system or application and exposes them in a format that Prometheus can scrape and ingest for monitoring and analysis.
The Prometheus Redis Metrics Exporter extracts metrics from Redis databases and makes them available in a Prometheus-compatible format. But we won\'t need it in our case since Dragonfly exposes Prometheus-compatible metrics out of the box! (available on http://\<dragonfly-host\>:6379/metrics by default)
Although 6379 is the default port, you can use the \--bind-admin and \--bind-admin-port flags respectively, to specify alternate host and port.
Let\'s start by setting up a simple environment to monitor Dragonfly. In this demo, We will have a Dragonfly instance running, along with a Prometheus instance to collect metrics and Grafana to visualize the metrics.
Before you begin, make sure you have the following installed: Docker, Docker Compose and Redis CLI.
To start with, Let's save the prometheus scrape configuration in a file called prometheus.yml. This file will be mounted into the prometheus container later.
global:
  scrape_interval: 15s

scrape_configs:
- job_name: dragonfly_metrics
  static_configs:
  - targets: ['dragonfly:6379']
EOFNext, we will create a docker-compose.yml file to define the services we need:
cat <<EOF > docker-compose.yml
version: '3'

services:
  dragonfly:
    image: 'docker.dragonflydb.io/dragonflydb/dragonfly'
    pull_policy: 'always'
    ulimits:
      memlock: -1
    ports:
      - "6379:6379"
    volumes:
      - dragonflydata:/data

  prometheus:
    image: prom/prometheus:latest
    restart: always
    ports:
      - "9090:9090"
    volumes:
      - .:/etc/prometheus
    command:
      - '--config.file=/etc/prometheus/prometheus.yml'
    depends_on:
      - dragonfly

  grafana:
    image: grafana/grafana:latest
    restart: always
    ports:
      - "3000:3000"

volumes:
  dragonflydata:

EOFUse Docker Compose to start Dragonfly, Prometheus and Grafana:
docker compose -p monitor-dragonfly upVerify that the containers are running:
docker compose -p monitor-dragonfly psFor each container, you should see the STATUS as running:
NAME | COMMAND | SERVICE | STATUS | PORTS |
|---|---|---|---|---|
monitor-dragonfly-dragonfly-1 | "entrypoint.sh drago…" | dragonfly | running (healthy) | 0.0.0.0:6379->6379/tcp |
monitor-dragonfly-grafana-1 | "/run.sh" | grafana | running |
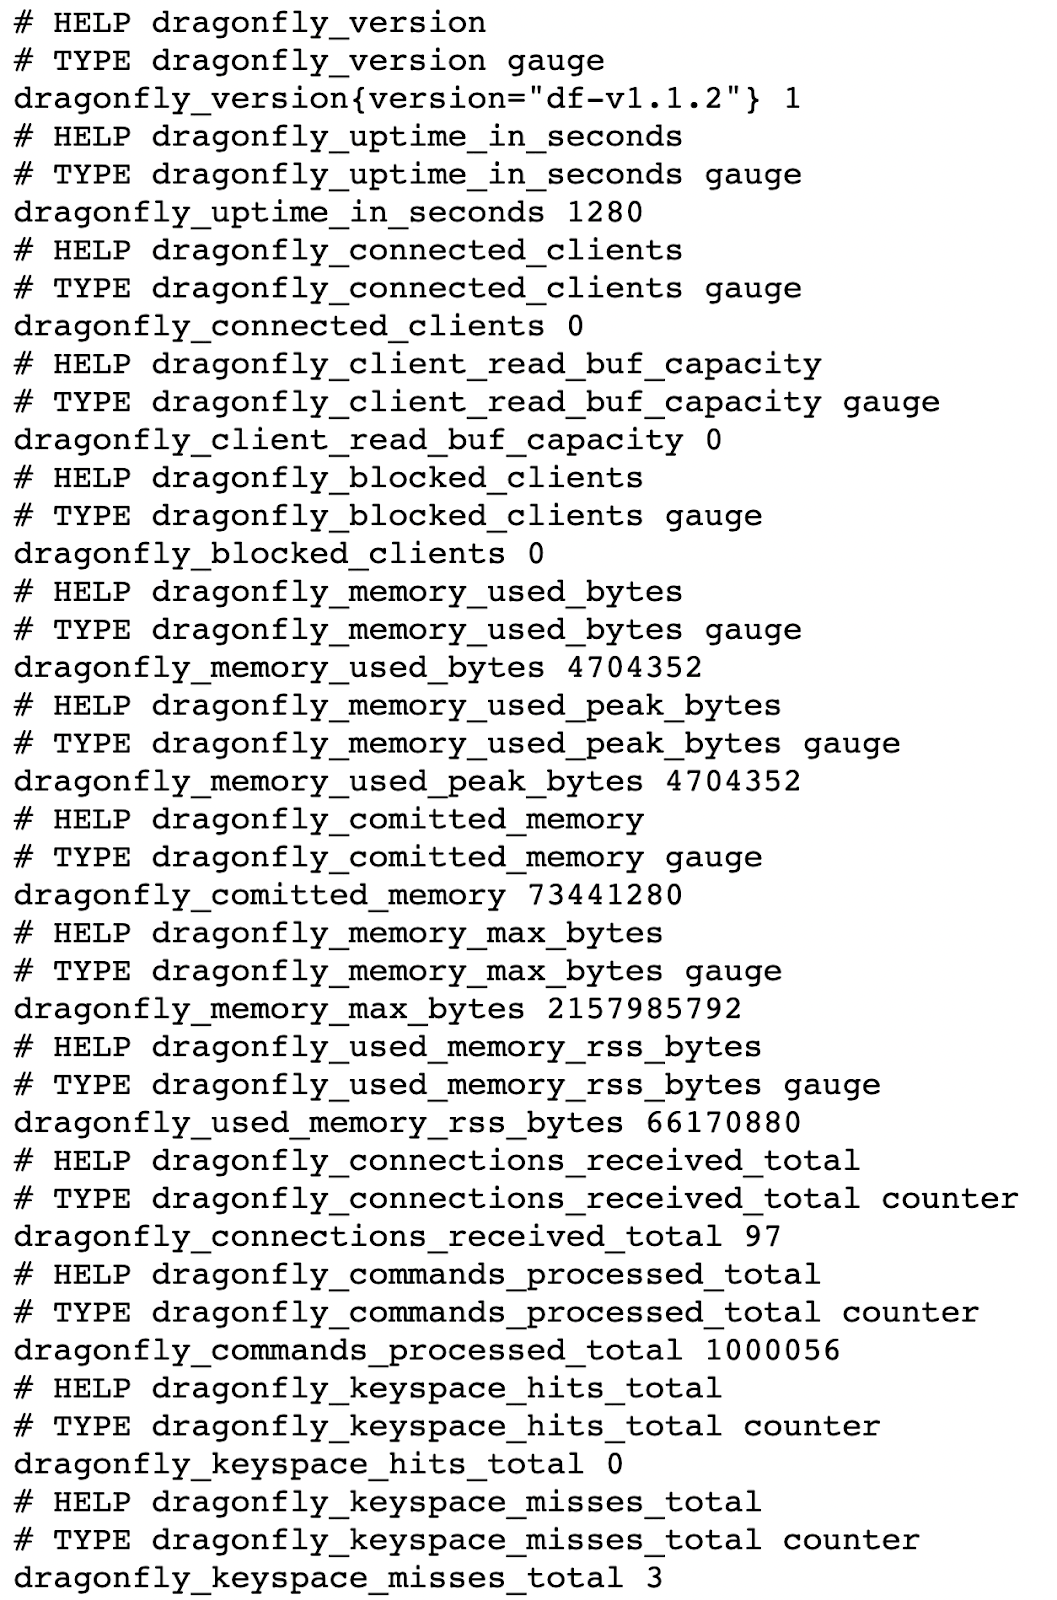
To check the metrics exposed by Dragonfly, navigate to http://localhost:6379/metrics in your browser:
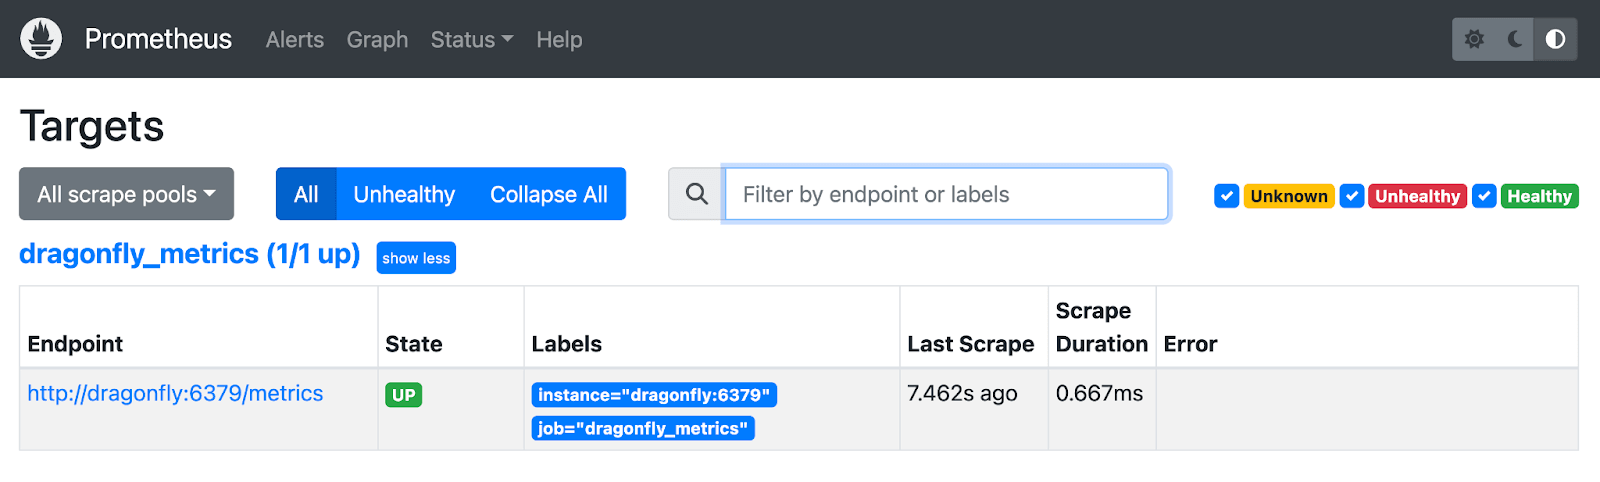
To see these metrics in Prometheus, navigate to http://localhost:9090. Select Status -> Targets from the left menu:
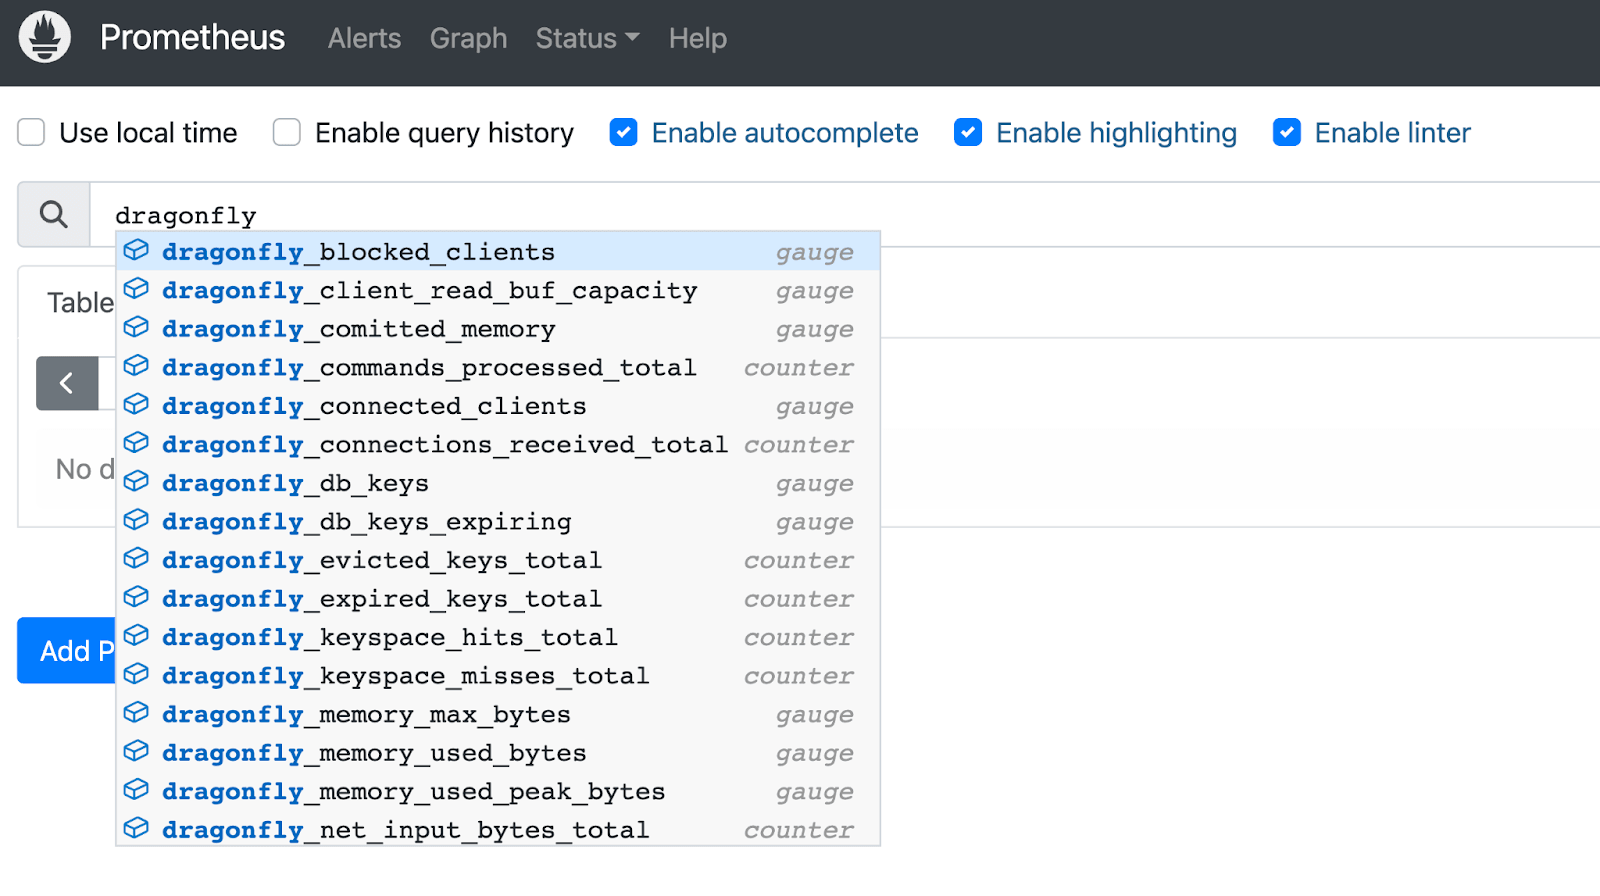
Search for metrics related to Dragonfly (they are exposed with a dragonfly\_ prefix.):
Most of the metrics available via the INFO command. Now let\'s dive deeper into some of them.
Client related metrics
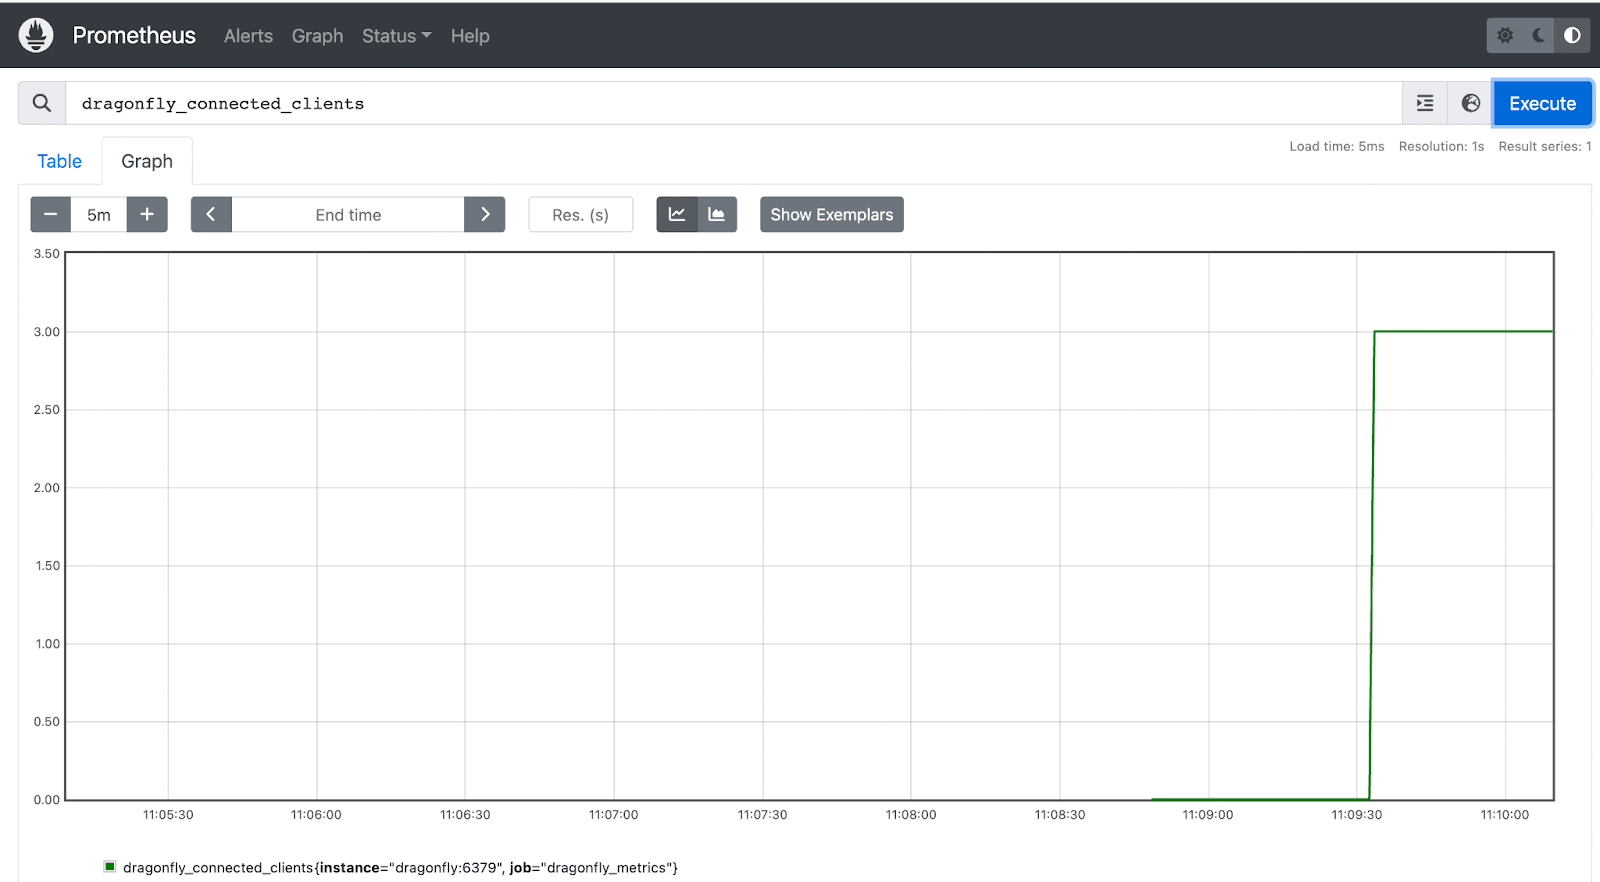
dragonfly_connected_clients
The dragonfly_connected_clients metric refers to the number of client connections that are currently established with Dragonfly. It includes both active and idle connections and monitoring it over time can provide insight into usage patterns and trends.
Let\'s connect to the Redis instance using three different redis-cli clients and see the value of connected_clients:
redis-cli -p 6379In a few seconds, the value of dragonfly_connected_clients should be 3, and you should see that reflect in Prometheus:
Monitoring this metric can help identify potential performance and scalability issues, especially with clients that are not properly closing connections. dragonfly_blocked_clients
The dragonfly_blocked_clients metric refers to the number of client connections that are currently pending on a blocking call with Dragonfly such as BLPOP, BRPOP, BRPOPLPUSH etc.
Let's open a few redis-cli clients with the following command to block on a List:
blpop test_list 15There should be a spike in the dragonfly_blocked_clients metric.
It should come down to 0 after 15 seconds (since that\'s the timeout we specified in the blpop command).
Server metrics
Let\'s look at Dragonfly server related metrics. For most of these, you can note down the initial value and then perform some operations to see the change in the metric value. The operation can be simple client operations using any Redis client or the load testing with the Redis benchmarking tool (e.g. redis-benchmark -t set -r 100000 -n 1000000)
Memory related
- dragonfly_memory_used_bytes - This is the total number of bytes allocated by Redis using its allocator. Note that this refers to the used_memory metric in the INFO command.
- dragonflyused_memory_rss_bytes - rss stands for _resident set size and this metric refers to the number of bytes that Dragonfly allocates as seen by the operating system. This is the number reported by tools such as top(1) and ps(1). Note that this refers to the used_memory_rss metric in the INFO command.
- dragonfly_memory_max_bytes - This is the value of the maxmemory configuration directive. Note that this refers to the maxmemory metric in the INFO command.
Keys related
- dragonfly_db_keys - This is the total number of keys in a specific db.
- dragonfly_expired_keys_total - This is the total number of key expiration events. Note that this refers to the expired_keys metric in the INFO command. If you add a key to Dragonfly with a time-to-live (TTL) value, they are automatically deleted by the server after the TTL. This metric counts the number of keys that have reached their TTL and been deleted. You can use the EXPIRE command to expire a key and see the change in this metric.
- dragonfly_evicted_keys_total - This is the total number of evicted keys due to maxmemory limit.
Use Grafana to visualize Dragonfly metrics
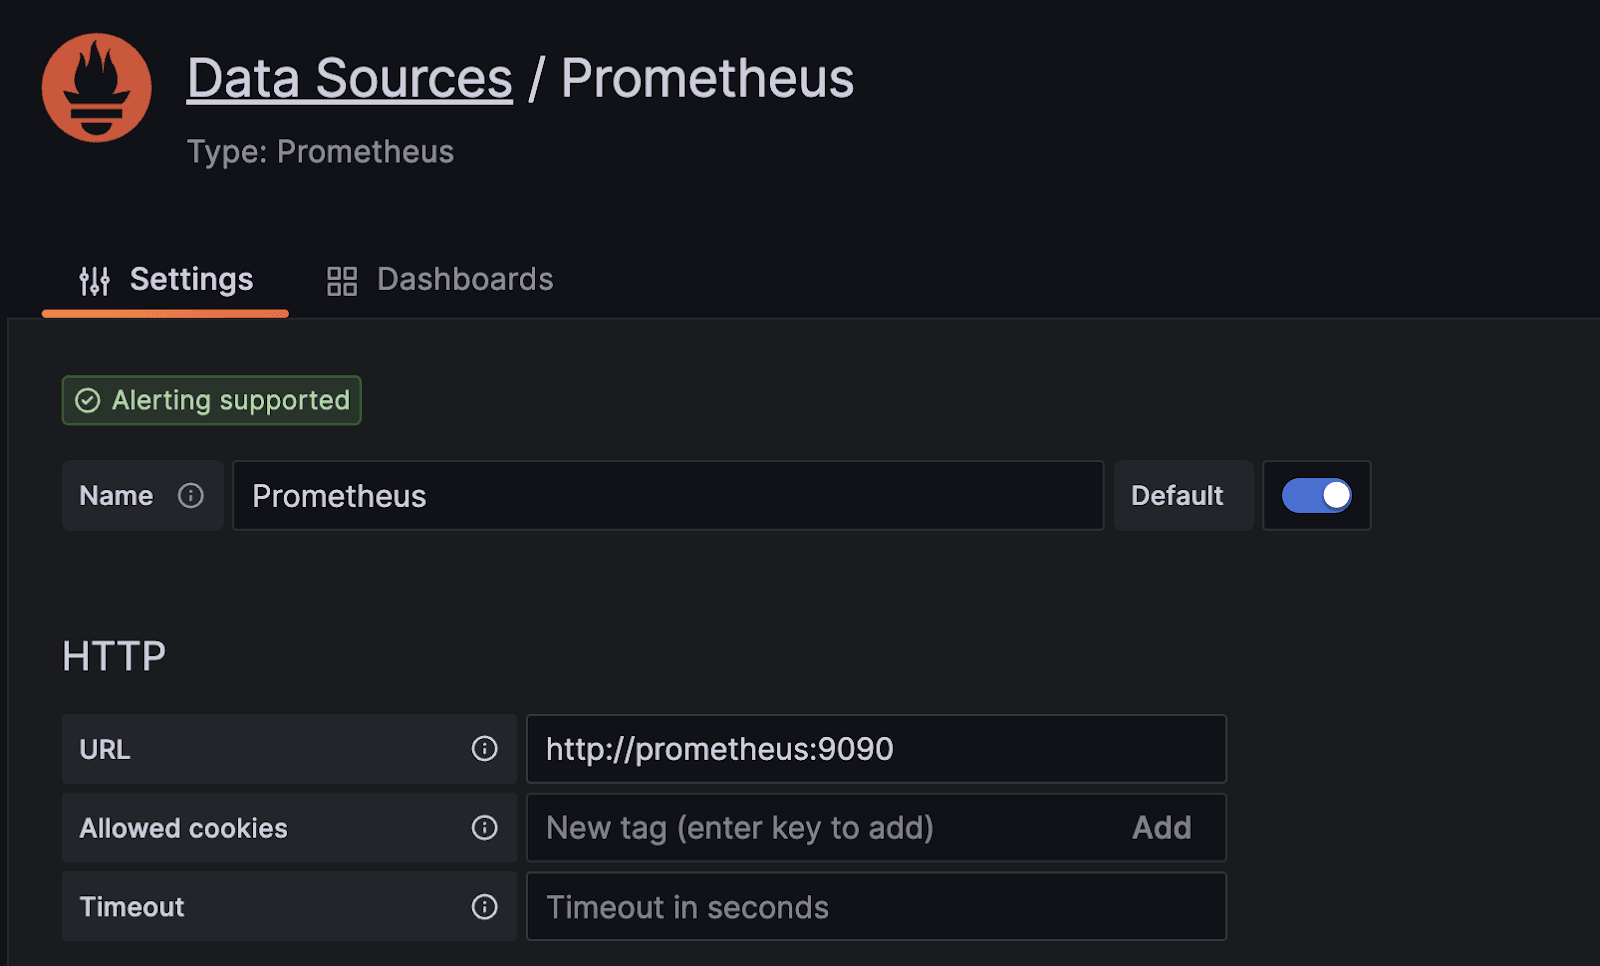
Navigate to the Grafana console at http://localhost:3000/ (use admin/admin as credentials) and start by adding Prometheus as a data source.
- From Add data source, select Prometheus
- Enter http://prometheus:9090 as the URL
- Select Save & Test
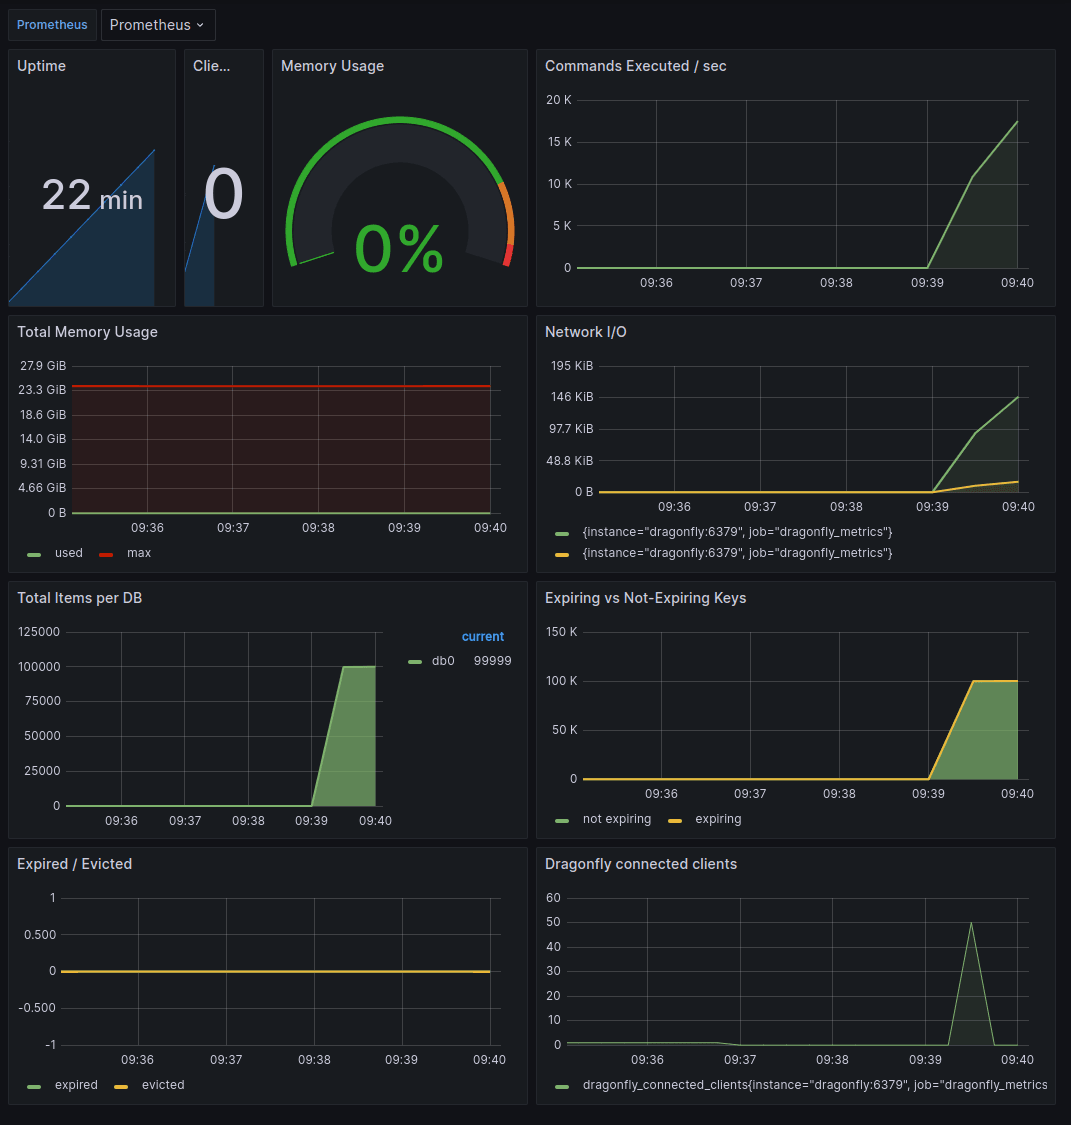
Although you can build you own Grafana dashboard, let\'s leverage a ready-to-use dashboard for now:
- Download the Dragonfly Grafana dashboard using this link
- Click Dashboards > Import in the side menu and upload the dragonfly-dashboard.json file you downloaded.
- On the next screen, select the Prometheus data source you just created and click Import.
To experiment with the dashboard, you can perform simple client operations using any Redis client or the Redis benchmarking tool as below:
redis-benchmark -t set -r 100000 -n 1000000You should now see the dashboard with metrics from Dragonfly:
Once you have completed the steps in this tutorial, use this command to stop the Docker containers:
docker compose -p monitor-dragonfly down -vConclusion
In this blog post, we explored how to monitor Dragonfly metrics using Prometheus and integrated with Grafana to visualize the metrics on a dashboard.
If you want to learn more, check out our documentation on how to fire up a DragonflyDB instance, bring along a client of your choice and start building with familiar Redis commands!